

Webhooks are a powerful way to get real-time data from Zoom. They can be used to monitor health of your Zoom account, get notified of important events, and automate workflows. Yet, this power isn’t without its perils. What if your webhook handler starts failing? Or even worse, what if Zoom stops sending the expected events to your endpoint? Facing these challenges myself, I’ve had a fair share of frustrations of relying heavily on Zoom real-time data. This post explores proactive monitoring on how to detect missing events in a timely manner, so that your application has time to recover and remains resilient.
Recently, I encountered a hiccup while monitoring Zoom meetings. A minor change in the way meetings were initiated, unexpectedly resulted in my backend no longer receiving notifications about finished meetings. After some investigation I discovered that for security reasons, Zoom had intentionally halted these notifications because the original meeting host hadn’t provided explicit consent. I recommend reading this thread in the Zoom Developer Forum if you are interested in details.
How to shield against a broken integration? Well, I would argue that monitoring is the best possible start. This post shows how to watch for missing events and gain actionable insights.
The Project
Feel free to download the source code from GitHub and follow along. The application is a simple Spring Boot web app leveraging Spring Actuator for metrics and monitoring.
Core dependencies:
implementation("org.springframework.boot:spring-boot-starter-web")
implementation("org.springframework.boot:spring-boot-starter-actuator")
implementation("com.fasterxml.jackson.module:jackson-module-kotlin")
implementation("org.jetbrains.kotlin:kotlin-reflect")
implementation("org.jetbrains.kotlin:kotlin-stdlib-jdk8")
implementation("org.springframework:spring-context-support")
implementation("io.micrometer:micrometer-registry-prometheus")
Let’s abstract away from complexities of dealing with Zoom webhooks. That’s a topic for another time. Instead, we stay focused on keeping track of meetings and times when they started and finished.
Our primary concern is observing start and end times of each Meeting. This is a matter of declaring a simple data class:
import java.time.LocalDateTime

data class Meeting(
  val id: String,
  val startedAt: LocalDateTime,
  var endedAt: LocalDateTime? = null
)
While the start time of a meeting is always a given, the finish time relies on receiving a meeting.ended notification from Zoom. Although our current implementation does not directly handle this event, for the sake of this discussion, let’s assume it does.
Next, let’s create a MeetingService that keeps track of when a meeting starts and finishes. The service instance leverages Micrometer in order to easily construct custom counters and other metrics.
import io.micrometer.core.instrument.MeterRegistry
import org.slf4j.LoggerFactory
import org.springframework.stereotype.Service
import java.time.Clock
import java.time.LocalDateTime
import java.util.concurrent.ConcurrentHashMap

@Service
class MeetingService(
    private val clock: Clock,
    private val meterRegistry: MeterRegistry,
) {
    private val logger = LoggerFactory.getLogger(MeetingService::class.java)
    private val meetings = ConcurrentHashMap<String, Meeting>()

    fun startMeeting(id: String) {
      // Create a Meeting, add it to the collection and update metrics
    }

    fun endMeeting(id: String) {
      // Find a meeting from the collection, populate its end time and update metrics
    }

    fun getMeeting(id: String): Meeting? = meetings[id]

    // Other implementation to follow
}
Starting a meeting is straightforward. Technically, the meeting is only started once but for simplicity we use a counter nevertheless. Note that the counter is tagged by the meetingId. This is important since it allows us to pinpoint the measurement to the specific meeting.
fun startMeeting(id: String) {
  logger.info("Starting meeting with id: $id")
  val meeting = Meeting(id, LocalDateTime.now(clock))
  meetings[id] = meeting
  meterRegistry.counter("meetings.started", "meetingId", id).increment()
}
Marking a meeting end involves calculating the meeting duration. The resulting duration in seconds is recorded along with the meeting id:
fun endMeeting(id: String) {
  logger.info("Ending meeting with id: $id")
  meetings[id]?.let { meeting ->
    meeting.endedAt = LocalDateTime.now(clock)
    val duration = Duration.between(meeting.startedAt, meeting.endedAt).toSeconds()
    meterRegistry.counter("meetings.ended", "meetingId", id).increment()
    meterRegistry.summary("meetings.duration", "meetingId", id).record(duration.toDouble())
  }
}
Watching for Missed Events
In Spring Boot, the @Scheduled annotation is used to mark a method to be scheduled for repeated execution with a specified interval or cron expression. A method marked with this annotation typically performs tasks such as clearing a cache, sending out reminder emails, or any other periodic activity. In our case, it’s a perfect use case for a regular check for stale meetings. A meeting becomes stale if it didn’t end within a specified time period. There’s a counter that increments with each new expiration period. This helps us understand how long has the meeting been left unresolved.
@Scheduled(fixedRate = 60_000)    // 60 seconds
fun checkForStaleMeetings() {
  val threeHoursAgo = LocalDateTime.now(clock).minusHours(3)
  meetings.filter { it.value.endedAt == null && it.value.startedAt.isBefore(threeHoursAgo) }
    .forEach {
      logger.warn("Meeting ${it.key} did not end within the expected time frame")
      meterRegistry.counter("meetings.stale", "meetingId", it.key).increment()
    }
  }
}
Monitoring with Prometheus and Grafana
The implementation is complete, now it’s time to harness the fruit of our hard labour. Spring Boot Actuator provides a series of built-in endpoints, including one for Prometheus exposed as /actuator/prometheus. The Micrometer Prometheus registry formats these metrics into the Prometheus-readable format which presents metrics in a format that Prometheus can scrape. Grafana supports Prometheus as one of its data sources, allowing you to use its metrics within your Grafana dashboards.
We’ll use docker-compose to run everything locally:
services:
  prometheus:
    image: prom/prometheus:latest
    container_name: prometheus
    ports:
      - "9090:9090"
    volumes:
      - ./prometheus.yml:/etc/prometheus/prometheus.yml
    command:
      - '--config.file=/etc/prometheus/prometheus.yml'
    restart: always
  grafana:
    image: grafana/grafana:latest
    container_name: grafana
    ports:
      - "3000:3000"
    volumes:
      - grafana_data:/var/lib/grafana
      - grafana_log:/var/log/grafana
    environment:
      - GF_SECURITY_ADMIN_USER=admin
      - GF_SECURITY_ADMIN_PASSWORD=admin
      - GF_USERS_ALLOW_SIGN_UP=false
    restart: always

volumes:
  grafana_data:
  grafana_log:
Make sure to add prometheus.yml in the root of your project. The configuration instructs the running instance of Prometheus to regularly watch for new metrics exposed via Actuator:
scrape_configs:
- job_name: 'spring_boot_app'
metrics_path: '/actuator/prometheus'
scrape_interval: 15s
static_configs:
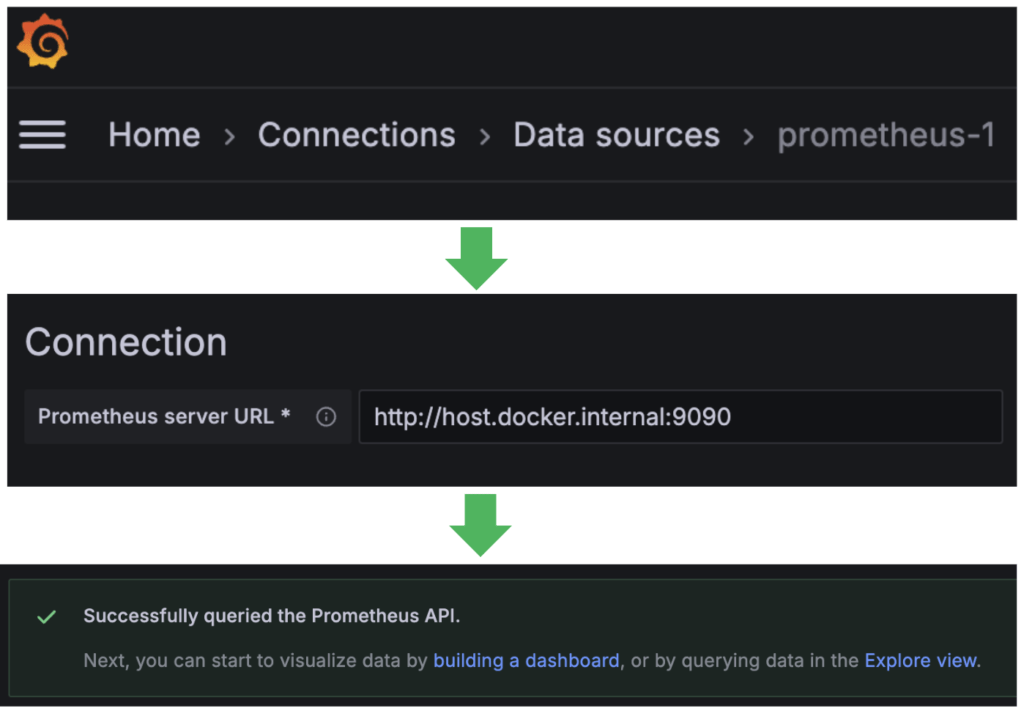
- targets: [ 'host.docker.internal:8080' ]If all works fine you should be able to see a successful connection in Prometheus:

Next, you should be able to connect Prometheus as a data source in Grafana:
Observing Events in Grafana
There’s a load script for testing purposes. The script reports several meeting events and, with a short delay, it follows with the corresponding meeting.ended events. However, some meetings remain in a pending state. That’s when our scheduled job kicks in, eventually flagging pending meetings as stale.
Here’s how the resulting dashboard in Grafana looks like:

Let’s dissect the individual visualisations and explore the metrics behind each of them.
Meeting Duration

Each bar represents the maximum recorded duration of the given meeting. Technically, max doesn’t really matter as each meeting only happens once. Here are examples of the metrics scraped by Prometheus:
# TYPE meetings_duration_max gauge
meetings_duration_max{meetingId="kbJS3IqfW2",} 5.0
meetings_duration_max{meetingId="Hz5l2bfAPi",} 10.0
meetings_duration_max{meetingId="8OP3oq8um6",} 12.0
meetings_duration_max{meetingId="UhIVPJolEI",} 1.0
Here is the query behind the visualization in Grafana:
sum(meetings_duration_max) by (meetingId)Total Count of Stale Meetings
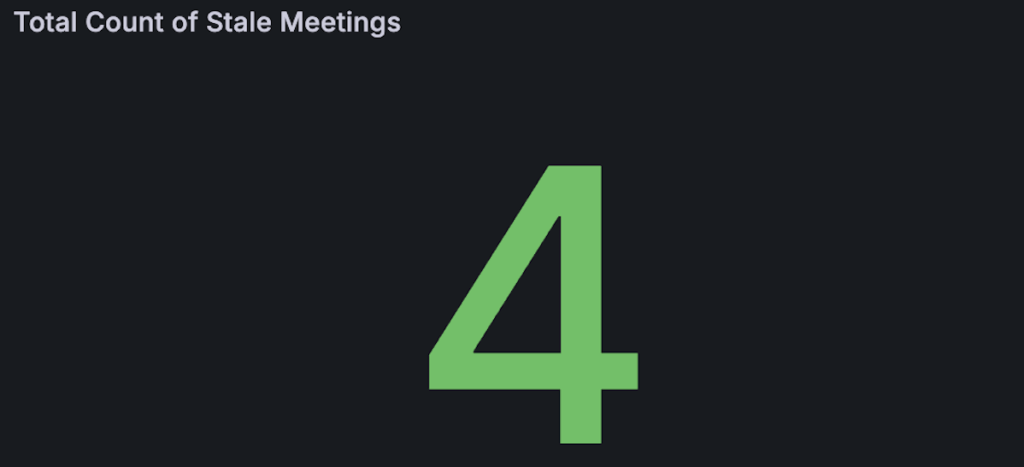
This simple visualization provides a quick insight into the extent of the issue. Under normal circumstances the value should never rise above zero.
Examples of the captured metric values where each value (1.0) represents the number of periods (every 3 hours) when the particular meeting was seen as pending:
# TYPE meetings_stale_total counter
meetings_stale_total{meetingId="2dMmOA8j4U",} 1.0
meetings_stale_total{meetingId="3LBUAPj1up",} 1.0
meetings_stale_total{meetingId="bmwSR3SN8C",} 1.0
meetings_stale_total{meetingId="Wc8nfipOUa",} 1.0
To arrive at a single number we simply count the occurrences of the anomaly:
count(count by (meetingId) (meetings_stale_total))Stale Meetings Overview
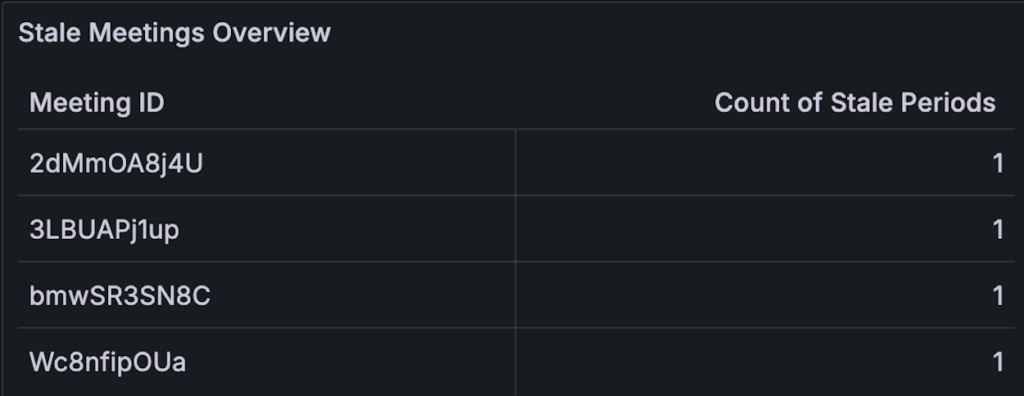
The table relies on metrics captured by the scheduled job reporting stale meetings. Whenever the count of stale meetings rises above zero the support team receives a notification. The Overview then helps the person in charge quickly identify which exact meetings are affected.
The query in Grafana boils down to:
max (meetings_stale_total) by (meetingId)Using max is essential, as we are only interested in seeing the latest state per meeting, e.g. the current number of missed periods.
Summary
In this post we delved into the challenging issue of missing events when working with Zoom webhooks. Remember, webhooks are not fail-proof and may not always work as expected. It’s crucial to anticipate and account for potential edge cases – especially when your application’s functionality is heavily dependent on webhook events.
We’ve leveraged robust open source monitoring tools that play well with Spring Boot and are easy to use. Hope you found the post inspiring. Let me know your thoughts in the comments section below.
As usual, the source code is available on GitHub.